ADVERTISEMENT

Wednesday, August 30, 2017

Email notifications

ATmatix is able to send you email notifications about patterns and other events detected. This option is available for PREMIUM users only (just a quick reminder, registering a new account gives you 15 days of PREMIUM account trial period for free).

Email notifications inform you about:
  • Newly identified price patterns (patterns that are emerging, but not yet confirmed with a breakout),
  • Patterns close to an upward or downward breakout (which may result in actual breakout and a further move in the direction of the breakout or changing the direction of the movement and bouncing back),
  • Patterns with breakouts,
  • Reaching predicted price targets, previously set by ATmatix after breakouts.

Specific stages of the patterns’ lifecycle (from their detection to completion) will be discussed in another blog post.

The email notification you get, obviously does not include all patterns or events from the day (or week), but is narrowed to the most important ones, which have the biggest potential – the largest expected rise (or decline, depending on the direction of the movement).

Defaultly, the notifications are enabled. To disable them or to change their frequency, you have to log in, go to the account settings page, by clicking your email address in the right upper corner of the screen or by choosing the “Account” option available in the dropdown menu (such as it is done in the picture):


Then, in the “Notifications” section you can disable or enable the option “I would like to receive notifications”, and specify both the scope of data and the frequency of the notifications.


The "data scope" list has two options:
  • All – the user will be informed about all the detected pattern occurrences and events happening on the instruments tracked by ATmatix,
  • Watchlist only – the user will be notified only about events detected for assets added to their Watch List. The Watch List is visible for logged-in users in the patterns table page. The table and Watch List usage tutorial can be found here.
Available notification frequencies:
  • Daily – notifications are sent once a day, after each trading session ends (with a slight delay), and it includes the events from the last (current) session.
  • Weekly – once a week, sent after the Friday trading session ends - it includes the highlights of the current week.

A valid example of such a notification, to be exact a part of it, you will find in the picture below. Individual sections of the messages relate to the onscreen sections of the pattern table and they are narrowed to the most important data, according to what I have written above. The data are sorted by the absolute value of pattern potential in descending order.


Each section has maximum of:
  • 10 items in daily notifications,
  • 20 items in weekly notifications.

Individual parts of the email notifications also include the events detected in the main indices/futures and industry (sector) indices of the WSE. We have decided to divide the assets into two groups, as usually the indices/futures price movements are smaller (speaking of percentages) than those for stocks.
Not dividing them could result in skipping some of the potentially important patterns on the indices, because of their low potential compared to the patterns detected for the stocks. In this way, it is easier to observe the technical situation of the selected group of instruments, in the broad market, or in individual sectors.

Last, but not the least, I would remark that the notifications are sent only when at least one pattern event has been detected in the selected data scope and the selected time period, since the last notification.


Labels: , , , , ,

Monday, August 28, 2017

Using the patterns list

This post describes the usage basics for the ATmatix patterns table. It is the most important part of the application. The list allows you to browse, search, filter and sort the patterns that have been automatically detected by our algorithms.

FILTERING

In the upper part of the web page, you will find the filtering buttons (tabs) that narrow the data view to patterns that are in a certain state – the tabs list is marked as A in the picture below:
  • All (without any filtering - all pattern states)
  • New/unconfirmed  – restricts the view to patterns which didn’t have breakouts yet; they may however be “close to upward breakout” or “close to downward breakout”
  • Near upward/downward breakouts – restricts the view to patterns close to breakout, but without the actual breakouts,
  • Upward/downward breakouts – narrows the view to patterns which had breakouts, but the target price after a breakout has not been yet achieved,
  • Completed – limits the view to patterns for which the target price was reached.


There is also the additional “Watchlist” button, which narrows the view to the assets that were added to the user’s favorites list. This button may be in enabled or disabled state and is visible to logged-in users only.
You can see the Watch List below the filtering tabs (marked as B in the picture). In order to add the stocks or indices to the list, you need to click (or tap) the list and type in at least 2 characters, to see the dropdown list with asset names that match the entered string.

After the entry is chosen from the list, it will be added to your Watch List. Attention: if a chosen stock has already been on the Watchlist and is chosen again, it will be removed from your Watch List.

To manually remove an asset from the Watch List, click the “x” button located next to the symbol in the list. You may also use backspace key to remove the last element from the list.
Clicking (or tapping) the symbol (but not the removal button of course) will narrow the content of the patterns table only to the selected asset.


SYMBOL GROUPS  FILTER

Below the Watch List, there are buttons additionally limiting the pattern list only to stocks that belong to a certain group (marked as C in the picture above).
Currently, the available groups are:
  • All (no narrowing) – all the patterns are visible (albeit the state filtering still apply, of course),
  • WIG20, MWIG40, SWIG80 – only stocks listed in the selected index,
  • Main indices – only the patterns for the main WIG indices (WIG20, WIG20SHORT, WIG30, MWIG40, SWIG80, WIG etc. FW20 futures are also included in this group),
  • Sector indices – only the industry indices, such as: WIG-energy, WIG-oil&gas, etc.
To disable the group filtering, click the “all” button.

TABLE VIEW

Below the Watch List, you will find the patterns table (marked as H in the screenshot).
The table is divided into pages, with max. 10 rows per page as the default. To change the number of entries per page, use the dropdown list (marked as D).
In the lower part of the list, there are navigation icons allowing you to move between pages (previous, next, page numbers) – marked as I in the picture.
Below the table, you can see the date of the last data update. The data is updated daily, after each WSE trading session ends.

The pattern list has the following columns:
  • Symbol/Ticker
  • Pattern type
  • Width (the number of sessions – or candlesticks – wthin the pattern, since the starting point of the pattern until its endpoint)
  • Potential – this is the range of the expected post-breakout price movement, calculated in accordance with the measure rule for a given pattern type, with the assumption of the anticipated (yet not 100% sure) breakout. The detailed information on target range measurement methods will be posted on the blog some time in the future. We have to mention that the value of the potential is being updated twice: right after the pattern detection and after a breakout (upward or downward) takes place.
  • Detection date – this is the day on which the pattern has been detected by ATmatix (also the date of the pattern’s end-point),
  • Near breakout – this is the last (newest) date of the price being close to the breakout level (upward or downward). Up or down arrow suggests the hypothetical breakout direction.
  • Breakout – the date of the actual breakout. The breakout can be the pattern’s confirmation or invalidation, depending on the type of the pattern, i.e. upward breakout is a confirmation for bottom patterns. The arrow suggests a breakout direction.
  • Target reached – the day the price has met the breakout target price range, previously set by ATmatix.  It means that the pattern was completed on that day.

SORTING

Data are sorted by default by the value of two columns: the date of the last event (in descending order) and the pattern potential (also in descending order). Depending on the choice of the tab (new, near breakout, breakouts, etc.) the default sorting changes into:
  • Detection date (descending order), potential (descending) – for the “new/ unconfirmed” tab,
  • Near breakout date (descending order), potential (descending) – for the “near breakout” tabs,
  • The date of the breakout (descending order), potential (descending) – for the “breakout” tabs,
  • The date of reaching the target (descending order), potential (descending) – for the “completed” tab.
Any time you can sort the data by the desired column, by clicking/tapping the column’s header. If you want to sort the data using more than one column, you need to press and hold the SHIFT key, and then, click the chosen columns’ headers in a desired order, to set the sorting.

To restore the default sort order, use the button located on the right of the search box – marked as G in the picture.

SEARCHING

In the upper side of the table, you can find the search input box – marked as E in the picture. The search engine allows you to find information according to the certain criteria. Type at least 2 characters – you don’t need to enter the whole name, ticker or symbol, but a fragment is just enough.

You may type:
  • A symbol, ticker or stock/index name. After typing at least 2 first characters the drop down list of the matching names opens.
  • You don’t have to choose the name from the list, as the filtering works immediately after typing a part of the name. If you decide to choose the name from the list, then the search results will be limited to that chosen asset.
  • Type of pattern – you can type a part of the pattern’s name (e.g. “wedge”, “bottom”, etc.)
  • The rest of the data visible in the table, such as pattern width, the potential, detection date, near breakout date, breakout date, and so on.
To use multiple search criteria, you need to separate them with space, e.g. “W20 bottom”, which will find all the bottom patterns for the instruments with names containing “W20”. For an exact match, you need to use the dot character (“.”), e.g..
  • ".WIG" (“.” in front of the name) narrows the results to the names starting with WIG)
  • "W20." (“.” following the name) restricts the table content to the names ending with W20
  • “.WIG.”(“.” In front of the name and following the name) narrows the results to the exact name (WIG only). 
To clear the search filter, you need to click the button marked as F in the picture (or delete the content of the “search” box).

PATTERN DETAILS


On the left side of each row in the table, there is a button that expands the pattern details (you can also double click on the row, to expand it, or – in the mobile version of the page  – just tap it once).

Details include:
  • Name/type of the pattern
  • Upward/downward breakout statistics (displayed only for the patterns for which a breakout didn’t occur yet) –  this is visible for PREMIUM users only – the percentage of upward/downward breakouts that happened in the past. Because there can be both upward and downward breakout (i.e. there is an upward breakout, then the price reverses without meeting the target and the downward breakout occurs – so called pattern bust). In such cases statistics count the stronger of the two moves that occurred after breakouts. Another scenario is – no breakout at all (ATmatix tracks the chart pattern only for limited time after the breakout). That’s why these statistics don’t have to sum up to 100%.
  • Target range/statistical pattern effectiveness – price target range computed after the breakout (usually two values). One of the values is based on the measure rule for the given pattern type (typically, adding the height of the pattern to the breakout level), and the second is based on the statistics of the past pattern performance. Because the subject is really broad and in the nutshell this is the most important part of ATmatix, we are going to write a separate blog post on this topic).
    Given are also the absolute values (the target prices) and the expected percentage change in relation to the price of the breakout.
    Statistical effectiveness is the percentage of the historical breakouts reaching at least the given level (for upward breakouts, the price should reach the given level or higher, for downward breakouts it should reach the given level or lower). This information is available for PREMIUM users only and it allows you to evaluate the chances for meeting the expected price level. 
  • Volume trend – measures the volume change between the first and the last detected point of the pattern (it is computed for all the pattern points from the starting point till the day of its detection). This is the value calculated by applying the linear regression method and the trend is determined with a regression line slope. Usually, the theory states that in most cases the volume is decreasing during the pattern creation, but we’re going to describe our research on this matter in a separate blog post.
  • The breakout price – the price, being a base of a post-breakout target calculation (breakout happens when the price pierces this level). It is a point on the trendline (or horizontal level) that limits the pattern (top line for upward breakouts, bottom line for downward breakouts). 
  • Breakout volume – the comparison of turnover volume on the day of the breakout with the average volume of 30 pre-breakout sessions. It is assumed that the breakout volume should be clearly higher, which increases the chance for a stronger post-breakout movement. We are going to research this matter more closely in the future. Volume information is available to PREMIUM users only.
  • The throwback/pullback statistics and break even failure rates for a given pattern type.
In the details view, there is also a button available, which allows you to add or remove the selected stock from the Watch List.
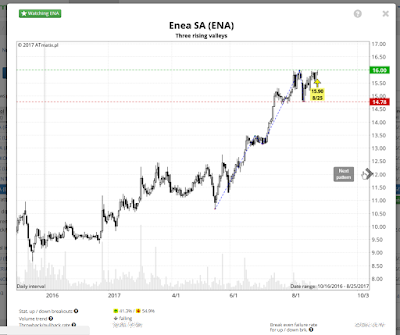
CHART VIEW

Clicking the stock’s name in the “Ticker” column, or the name of the stock in the pattern details, opens the chart view. It is a modal window where you can find candlestick chart for the selected pattern and detailed information about the statistics, price targets and volume.

This view allows you to browse consecutive patterns from the patterns table, using the hidden arrows in the left and right side of the chart. Those links are invisible and to enable them, you have to move the mouse pointer to the edge of the chart.
The chart view

It is also possible to use the arrow keys on your keyboard, to navigate between the patterns.

What is also worth mentioning, is the chart view respects the filters and sorting applied to the patterns table, so after switching to the chart view, navigation to the next or previous chart matches the content and sort order of that table.

Chart view may be closed by clicking the X icon in the upper right corner of the modal window, clicking outside the chart window or pressing ESC on your keyboard.

Just a few words about the content of the chart itself.
The horizontal axis contains the dates of the stock market sessions. The scale corresponds to daily intervals. The date range includes only the period in which the pattern occurred along with certain margins.
Vertical axis is the price value on a linear scale. The values of the turnover volume are placed in the background of the chart (as light gray bars) and are scaled so that the maximum volume value in the time period shown is at the top of the vertical axis. The absolute values of the volume are not shown.

The visualization of the pattern includes:
  • Blue dotted lines connecting the detected pattern characteristic points (only for certain types of pattern),
  • Green and red lines indicating the trendlines within the pattern – piercing these levels by the price result in upward or downward breakout. Horizontal price levels are shown as dotted lines. The levels narrowing the linear patterns such as: triangle, inverted triangles, wedges, inverse wedges, channels, etc. are shown as solid lines,
  • Blue horizontal dotted lines denote target prices (if the breakout occurred).
The events occuring as part of the pattern, are marked with arrows (some examples are given below):

  • “near breakout”, when the price approaches the breakout level, is marked with a yellow arrow (after the breakout, this information is hidden, so as not to unnecessary complicate the chart)
  • The breakout is marked with a green/red color arrow (green for upward breakout and red for downward breakout)
  • Meeting the target price range (the pattern completion) is marked with blue color arrow. Upward pointing arrow indicates that the target price after a downward breakout was reached. Downward pointing arrow denotes the price target was reached after an upward breakout. 
The colors of the arrows in the chart match the colors of the arrows in the patterns table. Next to each arrow the information about the event price and the date of the event is shown. In case of the “near breakout” and the breakout event, the closing price is displayed. In case of target achieved event, the daily low (L) or high (H) price is shown – depending on the breakout direction.


Labels: , , , ,

Friday, August 25, 2017

Payments and promotions

Registering new ATmatix account gives you 15 days of trial PREMIUM access without any fees. We don’t need any personal or credit card data except of your email and password.

After this period (15 days from the registration date) the validity of your PREMIUM account finishes and it becomes a regular account. It differs us from a popular “pay and test, then you may cancel within x days” model. Our approach is different, more beneficial for you. During those 15 days you can try and test all the features of our application normally accessible in a full version. If you are interested in maintaining the access to features such as: price pattern data for all WSE-listed stocks and indices, breakout, efficiency, throwback/pullback statistics for all price patterns and email notifications about the most important events, you can extend the validity period of your PREMIUM account. If not, then it automatically becomes a regular account, without the features mentioned above.

Additionally, if after subscription fee was already paid, you’re not interested in further access to those extra features any more, you can resign any time during the subscription period and you will get the refund of the unused part of that period.

To sum up, you get 15 days PREMIUM access for free, and within or after this trial period you can make a subscription payment to maintain the full access.


Feature comparison of regular and PREMIUM account may be found below:
Public (anonymous) access Registered users (account required) PREMIUM users (account and subscription required)
Chart pattern data for WIG20 stocks and selected WSE WIG indices
Favorite stocks list (Watch List)
Pattern data for the rest of the main market stocks, all WIG indices (including sector indices) and FW20 futures
Breakout, efficiency, pullbacks/throwbacks and break even failures statistics for price chart patterns
Email notifications
Volume analysis
Liquidity analysis
No ads


If the user wants to continue the PREMIUM access, he/she have to make subscription payment according to the pricelist given below.


What are the advantages of using the PREMIUM account? In short, we:
  • Detect the most known and popular price chart patterns (a lot from the list of technical analysis specialist Thomas Bulkowski; our list is not final and will be further developed),
  • Warn you if the price is close to the breakout (both upward and downward), which allows you to place a buy or sell order in advance  – you are given statistical chances of breakout in a specific direction (based on historical data),
  • Detect upward/downward breakouts, automatically setting the target price with the probability based on statistics of past pattern performance during the last few years for WSE (updated periodically). We compute not only the theoretical target levels, according to the technical analysis methodology, but also levels based on our own method of calculating targets of post-breakout price movement with their estimated probability – of course this is backed up with the statistics from the past data.
    If you think it’s not enough – our methodology allows us to estimate the price target after a downward breakout even for bottom patterns – this is our unique feature that you probably won’t  find anywhere else. It helps us to foresee (with some probability) how far the price is going to decline, when the new double bottom has emerged and then denied by a downward breakout, 
  • Alert you when the price target was met,
  • Compare a breakout volume in relation to the average pre-breakout volume, which strenghten (or weaken) the significance of such signal (very often – but not always –  the high relative volume indicate the possibility of a higher price movement),
  • Automatically notify you about those events via email (daily or weekly, as you wish).

In this way, you may reject or accept certain scenarios resulting from specific setups and evaluate if it is going to be profitable or too risky.

This allows you to plan your activities in advance. I personally often place buy stop orders, slightly above the breakout level, even before the actual upward breakout takes place. Many of my sell-limit orders, placed in advance with activation price set just below the target price, were also closed when a post-breakout target (predicted by ATmatix) was actually reached – thanks to our application and its probability estimation. From time to time, I’m going to post some examples of such setups in this blog. I encourage you to test the application, as it is free of charge for the trial period, and hopefully it will become your another useful investment tool.


Let’s take a look at the pricelist:
Subscription plans (for different validity periods) Price Additional bonuses
PREMIUM subscription 30 days

29 PLN

PREMIUM subscription 90 days

78 PLN

Money saving
9 PLN
PREMIUM subscription 180 days

138 PLN

Money saving
36 PLN
All fees are given in PLN (polish zloty). Please note that the amount paid in your local currency can be different due to varying exchange rates.

As you can see, depending on the number of days of the subscription plan, the average cost declines for long-term subscriptions. For the 180 days subscription you gain up to 20% discount (compared to renewals after each 30 days).
From time to time, we can also introduce some additional promotions and temporary discounts – in order not to miss them, just follow our blog and application pages.


Renewing of the PREMIUM subscription is as follows:

  • Choose your subscription plan from the pricelist – it’s available in the Payments tab of the account settings page. Mark the acceptance of the Terms of Service and immediate service execution. It means that you lose the ability to withdraw from the agreement within a statutory period (remember we gave you 15 days completely for free in the beginning). Later, you may cancel the agreement according to what is written above and to our Terms of Service.
    Then, click "go to the order details".
Subscription plan selection

Order details

  • If all the data in the order summary are correct, click “Go to the Payment form” and you will be redirected to the Payment Operator page. The Payment Operator is TPay.com – the payment form is visible in the screenshot below.
TPay order form

  • Choose your bank or payment method. Currently, non-Polish users can make payments using PayPal (which also has an option to pay with a credit card) or issue a SEPA bank transfer.
  • Next, fill-in the required form fields. Please, provide a working email address (it should be pre-filled with your ATmatix username), as it will simplify the payment status tracking –  the Payment Operator sends you status updates on the payment process. Should you have any problems, you can check your payment status using the payment ID provided by TPAY.
  • Click “Next” and you will be redirected to your chosen bank website or payment method, where you can confirm it. Please follow the instructions you see on the screen to complete the payment.
    Note: in case of a SEPA bank transfer, you will have to make a transfer by yourself using the beneficiary account number and transaction identifier provided by TPAY on the screen.
  • After a successful payment, you will be redirected back to our web page.
  • ATmatix will automatically extend the validity period of your PREMIUM account, as soon as we get the payment confirmation from TPAY. You will be informed about it via email. 

In most cases, the online payments will be confirmed within few minutes. In case of other payment methods (for instance, a regular bank transfer) it may take longer, up to a couple of days.


Labels: , , , , , ,

Free ATmatix account registration

Registering a new PREMIUM account is absolutely free of charge. With the premium account you are given:
  • The access to the automatic price pattern analysis for all the stocks and indices listed on the Warsaw Stock Exchange main market,
  • Email notifications about new patterns, patterns approaching breakout levels, the breakouts themselves and prices reaching the predicted targets,
  • The access to historical pattern statistics for WSE  - the effectiveness of breakouts (percentage of patterns meeting the target price) for each pattern type, the probability of upward/downward breakouts, pullback/throwback rates and chances for break even failure,
  • The analysis of volume trend during the pattern creation and the information on breakout volume.
The user, who registers new account, is given 15 days of PREMIUM access trial period for free and without any obligation. After 15 days, your PREMIUM account automatically becomes a regular account, unless you decide to extend the PREMIUM validity period.


To register, we don’t need any personal data, except of your email address. The registration process is as follows:
  1. By filling out the sign up form, the user gives their email address, which is also account’s name and chooses their own password. It should be at least 6 characters long, may contain letters, numbers and special characters (but not spaces). Not to mention the password should be difficult to guess and known only by the owner of the account.
  2. An email with the activation link is sent to the given email address. You have to click that link to fully activate your account. After submitting this form, check the message in your email inbox. Please note that some email providers may group messages in folders of different names, such as "offers" - if you could not locate our message, it may have been moved there or classified as spam.
  3. After a successful activation you can log in using the credentials you provided in step 1.


More information can be found in the Help section


Labels: , , , ,

Thursday, August 24, 2017

Introducing ATmatix

Welcome to the ATmatix, a blog dedicated to our technical analysis tool – an automatic price chart patterns detector.  Here, we are going to present the features of our application and publish own thoughts, ideas and research results concerning the Warsaw Stock Exchange (WSE), as well as other, hopefully interesting and helpful information about technical analysis.


A few words to begin with the application itself – we point at automatic detection of price chart patterns, such as the most popular ones: double bottoms/tops, head and shoulders bottoms/tops, triangles, wedges and many more, for WSE-listed stocks. 

Of course, you may find them yourself, but browsing through tens or even hundreds of charts everyday is rather tiring – and what is the most important – it takes your precious time that can be spent on other, most likely more interesting, activities. 

This is the reason why we decided to create an application that will make this process automatic and will even inform the users not only about the patterns detection but also about prices approaching a breakout level. It determines the price targets after breakouts, estimate their probability (oh yes, we have the historical and statistical data that allows it), inform you about the volume trend during pattern creation and during breakouts – and most importantly, it sends you notifications of the most important pattern events.

Motivation

The tool of technical analysis is undoubtedly really helpful while making decisions concerning purchasing or selling stocks and other financial instruments. Technical indicators, oscillators and candlestick charts are probably the issues most familiar to most traders. Many technical analysis applications and web portals calculate and make such data available for various world-wide markets. 

Of course, many people also use fundamental analysis of a given stock and probably take into account various factors, such as the current market situation or even current economic and political issues. You can find this information (financial results and indicators, analyses, recommendations) on many web pages.

However, we focused on a matter that seems to be slightly omitted on the Polish trading market. While detecting, for example, a candlestick pattern (consisting typically of one or more candles of a specific price scheme) or computing the RSI or MACD indicators does not represent a considerable technical challenge.

What requires much more effort is recognizing price patterns such as: flags, triangles, wedges and others – and this is not just purely technological effort.    In my opinion, the problem lies in almost no formalization of this methodology. Everyone knows how, more or less, should a double bottom or a triangle look like, but no one has tried to comprise them with, for instance, a formal mathematical definition, so as to using it would give you always the same result. We had to find some of the answers ourselves. Because of the nature of automatic algorithms, sometimes we can’t really recognize some of the patterns at first glance; in other cases, the ones that we think are matching the template don’t meet the formal definition, thus have to be rejected (for instance, the price goes beyond the pattern slightly too far, or the rise between the bottom and the top of the pattern is too small etc. - with the manual chart examination such details may be easily missed). Therefore, the results of the algorithms’ output don’t have to be acceptable to everyone, but some assumptions must have been made

A good clue and also an inspiration for creating ATmatix, were the works of an American trader Thomas Bulkowski. His website and books are a source of information on technical analysis patterns in an organized and methodological way. Of course, not all the information could be verified and you don’t have to agree with all of them. What is more, they may be inadequate for the reality of the Polish stock market, but in my opinion, it is the best database of technical analysis knowledge, so far. 


Undoubtedly, there are various plug-ins for technical analysis programs or other tools searching for patterns in the charts, but not all of them are free of charge and not all of them will give you information, which are the most valuable for traders. I’m sure you would like to know, for example:
  • What is the probability of upward/downward breakout in a given pattern?
  • How high (or how low) can the price go after breakout?
  • Which patterns are the most/the less effective regarding the likelihood of meeting the price target after breakout?
Those, and a lot more questions, we are going to answer in this blog and with our ATmatix service. If not – I am pretty sure, there are at least clues that will help you to make your own trading decisions. 

Clearly, no one is able to foresee the future, but having access to some historical data concerning the stock price behavior in the past may rise the chance of good trading setup recognition  and making the right conclusions – and this is what investing is all about. 


This is the moment to inform that any information published on this blog and the ATmatix service are not investment advice, and users are alone responsible for their decisions. We are not going to create an illusion of owning a crystal ball, which can tell “sell this now, buy that then”. However, we try to inform about the way our application works in the clear and accessible way. 


I encourage you to give ATmatix a try.

Best,
Piotr Kuciapski
Founder at ATmatix.pl


Labels: , , , , ,